

Visualizing Multivariate Data with UMAP:
A Geometallurgical Approach to Sample Representativity
Introduction
Visualizing multiple variables in a complex dataset can be overwhelming, especially in geometallurgy, where orebody characteristics drive processing outcomes. Traditional methods struggle to handle the high-dimensional data typical of modern geological datasets. Uniform Manifold Approximation and Projection (UMAP), a powerful dimension reduction algorithm, offers a solution. This article explores how UMAP simplifies multivariate data visualization, enhances metallurgical sample selection, and ensures representativity in geometallurgical modelling.
What is UMAP and Why Does It Matter?
UMAP is a machine learning technique that reduces high-dimensional data into a smaller number of dimensions—typically two—for visualization and analysis (McInnes et al., 2020[1]). Unlike other dimension reduction methods, UMAP excels at preserving both local and global data structures, making it ideal for analysing complex datasets like drill hole assays or block model values. The resulting two-dimensional scatterplot groups similar data points in a multivariate sense, where proximity reflects similarity in characteristics, not necessarily spatial relationships.
In geometallurgy, UMAP enables researchers to visualize the multivariate characteristics of an orebody, such as mineral assemblages, textures, and grades, in a single plot. This provides a clear, reproducible way to assess whether metallurgical samples represent the full range of ore types in a deposit.
The Challenge of Metallurgical Sample Representativity
An ore type is defined as mineralized material of economic interest with consistent mineral assemblages, textures, and grades. Ore types often form complex spatial patterns shaped by the deposit’s geological history, and their metallurgical responses depend on multiple variables. However, metallurgical testwork is inherently data-poor, as only a small fraction of the orebody is tested before mining. In contrast, modern drill hole databases are data-rich, containing:
- Assays for 30+ elements.
- Hyperspectral mineral analyses.
- Bulk density and rebound hardness measurements.
- Visually logged rock types and textures.
Traditional statistical or graphical tools, limited to one, two, or three dimensions, struggle to assess sample representativity across such diverse datasets. This is where UMAP’s ability to handle high-dimensional data becomes invaluable.
Applying UMAP in Geometallurgy
Geometallurgy leverages abundant geological data to maximize the value of sparse, high-cost metallurgical testwork. By applying UMAP, we can align metallurgical samples with geological data to ensure they represent the orebody’s variability. Here’s how UMAP transforms the process:
- Visualizing Ore Type Variability:
UMAP reduces complex datasets into a two-dimensional scatterplot. Points close together share similar multivariate characteristics, allowing geologists to identify distinct ore types. For example, a scatterplot coloured by mineral concentrations can reveal clusters corresponding to different ore types.
- Assessing Sample Representativity:
By plotting metallurgical samples on the UMAP scatterplot, we can evaluate their coverage of ore type variability. For instance, a scatterplot divided into seven groups (interpreted as ore types) might show that samples (e.g., orange and blue dots) cover most groups but miss certain regions (e.g., green dots), highlighting gaps in representativity.
- Guiding Sampling Programs: UMAP provides a data-driven framework to select samples that capture the full range of ore characteristics. This ensures metallurgical testwork reflects the deposit’s complexity, improving the reliability of process predictions.
Case Study: UMAP in Action
Consider a UMAP scatterplot generated from a drill hole dataset:
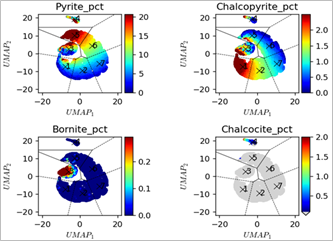
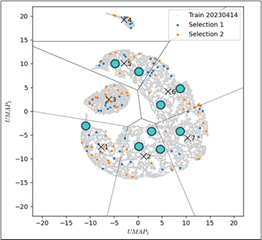
- Left Plot: Coloured by mineral concentrations, it reveals seven distinct clusters representing different ore types.
- Right Plot: Metallurgical samples (orange and blue dots) are overlaid, showing good coverage across most clusters but poor representation in some areas (green dots).
This visualization enables geologists to assess whether their samples adequately represent the orebody and identify areas where additional sampling is needed. By linking UMAP results to geological understanding and metallurgical testwork, teams can refine sampling strategies and improve process design.
Best Practices for Using UMAP in Geometallurgy
To maximize the benefits of UMAP:
- Integrate Diverse Data: Include all relevant geological data (assays, hyperspectral data, physical measurements) to capture the full range of ore characteristics.
- Interpret Clusters Thoughtfully: Use domain expertise to validate UMAP-derived clusters as meaningful ore types.
- Iterate Sampling: Use UMAP to identify gaps in sample representativity and guide additional sample collection.
- Combine with Other Tools: Pair UMAP with clustering algorithms like K-Means to further refine ore type definitions and sample selection.
[1] There are other dimension reduction algorithms that could also be used. See McInnes et al, 2020.
Next Steps
Ready to simplify multivariate data analysis and optimize your metallurgical sampling? UMAP offers a powerful, data-driven approach to ensure your samples represent the full variability of your orebody.
Contact our team at
geometallurgy_support@amcconsultants.com to explore how UMAP can enhance your geometallurgical workflows and drive better processing outcomes. Let’s make your data work smarter—start visualizing with UMAP today.
Paul Greenhill, FAusIMM(CP)
Principal Consultant
pgreenhill@amcconsultants.com